Docs Concepts
X-Ray
How each machine behaves, live and over time, with usage, peaks and bottlenecks, and the work it did for you.
To use idle capacity well, you have to know how each machine behaves. X-Ray shows it, and points out what to do about it.
Live
- What the machine is using now: processor, memory, disk and network.
- What is running on it, process by process, with the ones that matter most to the company marked, such as a database.
Over time
- The usage history for the last 24 hours, 7 days or 30 days, with the average and the highest point of each stretch.
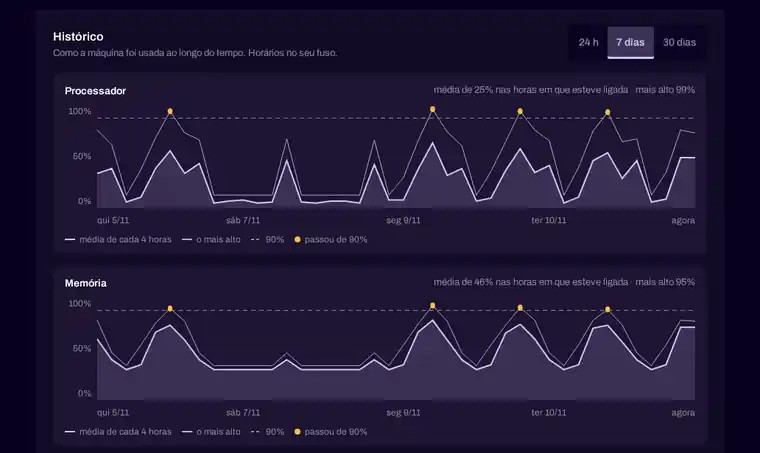
- The peaks: when the machine ran close to its limit, and what was using it most at that moment.
- The bottlenecks: how many hours the processor or the memory spent above 90%, and how fast the disk is filling up.
- The work it did: how many hours of work the machine delivered to services in the period.

What you find out with it
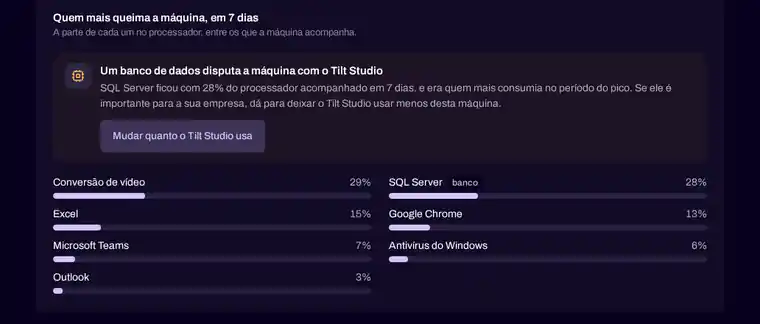
- When each machine is really free. A finance machine busy from 8 to 6, with a peak at lunchtime when the closing database and the antivirus run together, and the whole night to spare: that is where heavy work fits.
- Who competes with whom. When an important program, like a database, shares the machine with service work, X-Ray says so, and the limit for that machine is one click away.
- What is about to go wrong. A disk that, at this pace, fills up in three weeks shows up before it stops anyone.
- What to buy, and what not to. Memory that sits above 90% for hours says more memory helps that machine. A processor that is idle at night says no new server is needed for night work.
The list of processes over time is available on Windows machines. On the other systems, X-Ray shows the live view and the history of processor and memory.